I Can Haz Data?

June 23rd, 2008

Image from anomalous4's photostream on flickrI am currently in the process of getting grade data to be shared between Moodle and Adobe Flex with Flare in a secure and elegent way.

Flare has some nice built in functions for loading data from a url that is either in a tab or json format, witch would normally work great except the data in question consists of students grades and statistics relating to them witch can not be publicly shown and is protected by Moodle’s capability system. This means that Flare can not simply load a page that outputs the data in tab or JSON format as it would not have the session or cookie that the browser does to let Moodle know that you have the capability to access the data so it just gets the HTML for an error page.

Passing a user name and password (or hash there of) between the Flash Player and the web server are out of the question for security reasons and embedding all the data needed to generate the visualizations in the Flash variables or JavaScript becomes ugly fast and could break down in the cases of very large sets of data (there is a limit to the length of a Flash variable passed from HTML). There also is no way i know of to share a browsers cookies with Flash and then the sites it calls on (and if there is it would mean recoding how the Flare DataSource class works).

The solution? Well the method i am country working on is passing the session name and id from Moodle to Adobe Flex/Flash (threw the Flash variables embedded in the HTML generated by PHP) and then using the Flare DataSource class to load the URI of the JSON formated data with the course id, session name, session id and graph/visualization type appended to it. Hopefully this method will work like how cookieless sessions do in Moodle where the session information is appended to the URI and Moodle will see the request as if it came from the user them self, with the correct capabilities.

My only concern with this method is if a teacher or student where to save the HTML of the page and send it to some one it would contain there session information. In theory this information could be used to access the account that is tied to the session and the attacker could then change the password for the account to take it over. However this would only be possible for the period of time when the session is valid and would be just as insure as Cookieless sessions all ready are in Moodle (in terms of a user copy and pasting there URI with the session id in it) and a user would have to willingly give a copy of the HTML to the attacker.

If all goes well i will have a simple demo of this before the end of the week that can show a simple graph of grades using Flare.

Debugging Flex

June 23rd, 2008

flex-icon.pngAs i have been working with Flex and the Flare library to make a test program to send data from Moodle’s Grade Book to Flash i have ran in to a problem running the Flash debug player.

When i trying to “Debug as Flex Application”, the application would come up in Firefox but in the debug console in Eclipse i would get something along the lines of “Waiting for Flash Player to connect to debugger” and then eventually an error about it failing to connect. If the debugger was working it would provide needed information from the running flash application including text you send back using the trace command.

The problem it seems is that when installing Adobe Flex Builder for Linux, a flash player for Mozilla Firefox is also installed. However the player that was installed was not the debugging version but a normal copy of Flash 9. So it could play compleid Flex applications but not connect to Flex Builder to display needed debugging information. Lucky, although the debugging version for Firefox was not installed a copy of the stand alone debugger was but had not been set up in the path environment variable.

For me the stand alone player was copied to /home/dan/Adobe_Flex_Builder_Linux/Player/linux/flashplayer and all i had to do was add the path /home/dan/Adobe_Flex_Builder_Linux/Player/linux/ to the global path variable and restart the computer (for some reason the path will not update in Eclipse in till you at least log out and back in again). Then to make the “Debug As” command open the application in the stand alone player rather then in Firefox, the path to launch has to be changed from launching the html file to launching the swf file (for me this was a change from /home/dan/workspace/flare_test/bin-debug/flare_test.html to /home/dan/workspace/flare_test/bin-debug/flare_test.swf). This change must be made in Debug Dialog witch you can get to threw the “Debug As” menu. Now when running “Debug As Flex Application” the Flex Application will open in the stand alone player with debugging working and “Run As Flex Application” will open in Firefox using the normal Flash 9 player.

Also it seems that Adobe accepted by application for a educational licenses for Flex Builder, so i no longer have to worry about the time running out or it deactivating witch is nice.

CVS: CONTRIB-496 - 20/Jun/08

June 20th, 2008

I am going to start posting version control commit messages of the changes i make, to this blog so any one who is interested can get the latest news in one place rather then having to look at the blog, issue tracker and the cvs history. Also i hope this might encourage more feedback on each change or at least some of the changes and development. So here we go…

CONTRIB-496
Made the printable tab open in a new window.

MODIFY plugins/grade/report/stats/tabs.php   Rev. 1.4   (+2 -1 lines)

Adobe Flex + Flare

June 19th, 2008

box_flexbuilderstandard3_150×150.jpgNow that the report/stats plug-in has a release out i have started geting Adobe Flex and Flare set up for the report/visual plug-in.

The first issue i ran into is that i could not find a copy of Adobe Flex Builder or the Eclipse plug-in for a Unix/Linux based operating system witch i am using for development. There site seems to only list versions for Mac and Window even tho flex is sposted to be cross platform. After some time searching tho i was able to find an alpha version of Adobe Flex Builder for Linux from Adobe Labs.

Another issue that may come up for students is the cost of Adobe Flex Builder, normally it is priced at $249 for the standard version and $699 for the professional version but there is a time base trial version that can be used for 60 days. luckily for students and other persons in education institutions, Adobe offerers a free educational version with proof of enrollment. I have applied for the educational license but i can take up to two weeks for them to e-mail you with the key so in till then i will be using the trial version. There is a stand alone Flex SDK that is free and lets you use any IDE you like witch would also solve both theses issues but is apparently more complexed to use and has less features.

The next step in setting up Flex was the installing process. For Linux the installer comes in the forum of a bin file witch you can execute by typing “sh filename.bin” in the console. If done correctly a GUI based installer will pop up and guide you threw the install process. Unfortunately this step was not totally strait foreword as one of the requirements is Eclipse 3.3 when the package system i am using still lists 3.3 as unstable. So i had to remove the mask on version 3.3 and all a bunch of it’s dependency to updated to the new version.flare-logo.gif

Now to add in flare, i had to download the prefuse flare libraries and unzip them in to my workspace directory and with that Adobe Flex and Flare should be installed on my Linux laptop and ready for development. In my next post i hope to talk about getting started with flare and talk about the start of the report/visual plug-in.

As for report/stats, i have added a printer friendly version and option to invert the statistics table to report/stats witch can be seen on the demo site, this lets users have the table extend downwards rather then width wise so the report will fix on there screens and be easier to print.

CVS, Demo and a Bug

June 17th, 2008

I have committed the code for my first version of the report/stats plug-in to the Moodle cvs (in the contrib module). You can brows the contrib cvs files here or you can download a copy of the nightly build of the stats report at http://download.moodle.org/plugins/grade/report/stats.zip.

There is also a public demo online located at http://compsci.ca/~dan/moodle/. You can login as a guest, go to a course, click grades in the lower left hand menu and then select stats report in the drop down menu at the top left to see the stats report. You may also create an account and sing up as a student to see how tasking some of the tests effects the stats report.

My latest development efforts where slowed down some what due to a new bug creeping in to some of the core Moodle 2.0 code and everything breaking for me once i updated to the latest version threw cvs. Lucky i was able to report the bug and submit a patch to fix it and it was added to the cvs so everything is back to working. You can find out more about the bug at http://tracker.moodle.org/browse/MDL-15253. It was not much of a patch (just changed one line) but it is kind of cool seeing your bug report and patch get in to an open source project.

For up to date information on the project including cvs commit messages you can view the tracker issues and sub issues set up for it at: http://tracker.moodle.org/browse/CONTRIB-477 (report/stats sub task here).

Making SciTE Play Nice With Moodle’s Coding Guide Lines

June 14th, 2008

The Moodle community has a long list of specific guide lines for how to write and format your code, most of witch are there for a good reason or to ensure similar coding styles. However one of theses rules specified that all indentations be exactly four spaces and no tab characters be used in the document at all.

Although doing this by hand is possible in a simple editor, the IDE i am using, SciTE, likes to auto indent lines with tabs and even if it did not it would be a pain to count out four spaces each time you need to indent. Lucky there is a way to make SciTE do this for you and ensure all tabs and indentations are four spaces even if you hit the tab key.

All you have to do is add the fallowing to the user options file, /home/yourusername/.SciTEUser.properties :

# Indentation
tabsize=4
indent.size=4
use.tabs=0
indent.auto=1
indent.automatic=1
indent.opening=0
indent.closing=0
tab.indents=1
backspace.unindents=1

This will ensure that your indents are four spaces, will change any tabs it sees to four spaces and auto indent code for you as you type it. Also you will only have to hit backspace once to remove a four space indentation rather then four times.

grade/report/stats

June 11th, 2008

The first of two plug-ins i am making for the Animated Grade Statistics Report project is at a point where i think i can start showing it to the community and get more feed back. I am talking with Anthony Borrow about getting a tracker issue set up on the Moodle Tracker and get CVS access so i can work in/with the repo.

In till then, i have some screen shots of what the the text based plug-in for stats currently looks like:

stats_1.png

grade/report/stats is some what based on grade/report/grader (an existing standard plug-in) in terms of layout and how the data is presented but rather then students grades for each item it displays statistics for both items and aggregations (such as Course total). Each statistics, such as Highest, Lowest, etc, is a class that extends an abstract class called stats. Theses classes are then automatically loaded in and the grades witch are harvested from the database and filtered are passed to a report method in each class witch returns the result of the statistics calculations and passed along to an adapter method witch changes it all in to a nice HTML based table (using flexible_table class).

Using this method it means that a new statistic could be added to the table simply by making a new class for it with the code to process the grades and adding some language strings. So no code in the plug-in it’s self will need to be changed.

stats_2.png

There are also user options available in this plug-in witch allow the user to control what statistics are displayed, how they are calculated, what items are displayed and the format the stats are displayed in. The settings for what stats are to be displayed are automatically generated based on what stats classes are found, so a person adding a new statistic to the plug-in will not have to worry about the settings page.

stats_3.png

Like the grader report there are also toggles on the top of the report witch can be used to display less or more information and there is the functionality to filter the statistics by group. So if wanted only the statistics for one section of a course or one particular group can be displayed. You can also see in the last screen shot the issue mentioned in my last blog post here, about scales returning some interesting results for some statistics, tho if desired all scale based items can be hidden in the plug-ins options.

There are still a few things left to do for the text based report:

  • Add outcomes
  • Improve the look and readability
  • Add admin/teacher settings to override if a student can see a given statistic.
  • Add help text for the settings page
  • More settings
  • Let stats classes have the ability to set the format of the statistics they output (value, scale, letter, percent).
  • Printable version.

As some of theses are less critical i will probably start working on the visual plug-in as it is more important well getting feed back and the tracker/cvs access set up and come back to it latter on in the project.

Onward to flare!

Whats the Average of “Not satisfactory” and “Outstanding”?

June 6th, 2008

monkey_math.gif
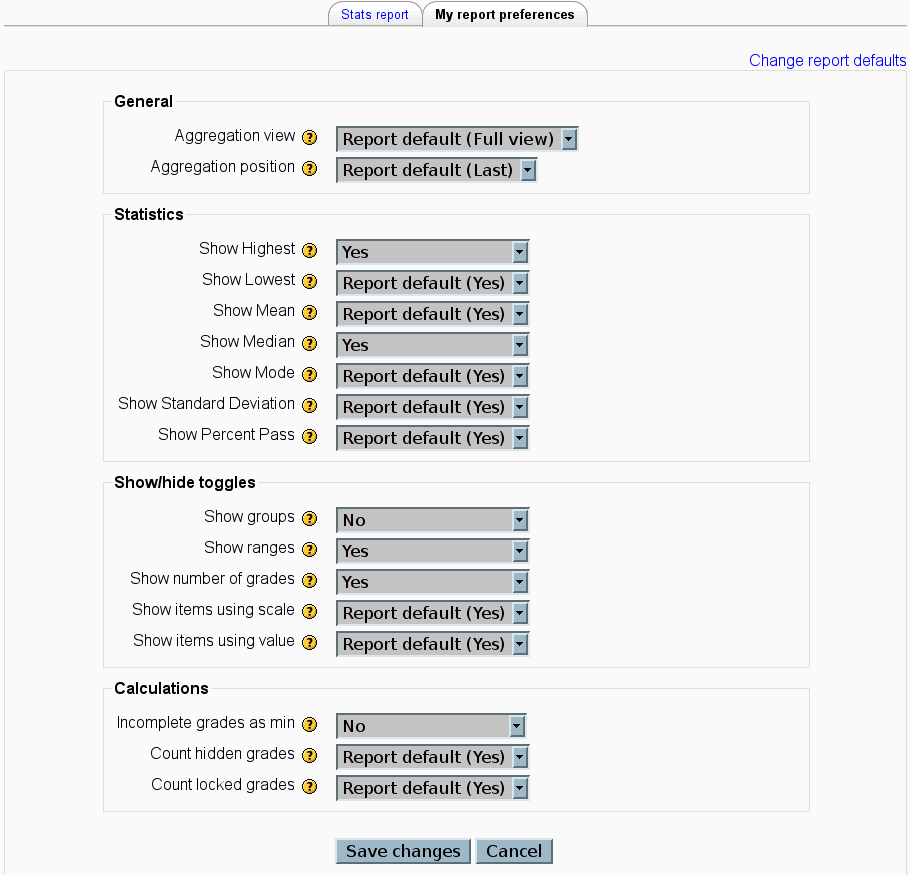
…or better yet what is the standard deviation? One of the issue i have come across well working on the stats plug-in for Moodle are grades that are not necessarily numerical values. Moodle allows for both text based grades and scales (witch are strings based on ones performance in a garble item) and it brings up the problem of how to work these grades in to common statics like mean, standard deviation, etc. For some like the mode this is simple enough to deal with and when a scale is used things like max and min grades are possible (by assigning a numerical value to each string in the scale) however something like standard deviation becomes meaningless at best (especially when expressed back in the same scale, the deviation between “Not satisfactory” and “Outstanding” is “Not satisfactory” and the average is “Satisfactory”??). What it might come down to is simply not having statistics for none number based grades or trying to find a method to express them threw a more sensible means.

Also i have made some progress on /grade/report/stats plug-in and have a demo on my test server that has the statistics per item per group as well as overall in a table. Still to do is to add options for dealing with things like hidden grades, selecting what grades users can see and cleaning up the look of the table. After that i can move on to working on the visual plug-in and the real fun can start. (I had ornignaly planed to talk about the desing of report/stats plug-in in this post but i am busy working on getting a more advanced demo up so it will have to wait and i shall have to get back to coding!)

Moodle Grade Book Plugins

June 5th, 2008

My Internet has been down from late Friday (30th of May) night till about mid week and still is dropping a lot of packets thanks to bell, witch has made it some what difficult to look at the references for PHP and Moodle but I still have hopes to have a demo of the text based statics plug in done by this Friday or at worst this weekend.

One of the big things in Moodle is it’s modular design witch makes it rather easy to drop in new components and plug-ins with out having to change much if any of the existing code. Grade book plug-ins are no exception to this and can be dropped in to grade book by making a new directory in grade/report/ with the name of your plug-in, then a few files need to be created inside it:

/grade/report/[yourplugin]/db/access.php
<?php
$gradereport_stats_capabilities = array(
'gradereport/stats:view' => array(
'riskbitmask' => RISK_PERSONAL,
'captype' => 'read',
'contextlevel' => CONTEXT_COURSE,
'legacy' => array(
'student' => CAP_ALLOW,
'teacher' => CAP_ALLOW,
'editingteacher' => CAP_ALLOW,
'admin' => CAP_ALLOW
)
),
);
?>

This file controls the access to your plug-in and the risk of giving roles access to it. I believe these settings are turned into new rows in the capabilities part of the database.

/grade/report/[yourplugin]/lang/en_utf8/gradereport_[yourplugin].php
<?php
$string['modulename'] = '[yourplugin'sname]';
$string['[yourplugin]:view'] = 'View [nameofyourpluginsreport] report';
?>

This is the langue file where all the strings should go so they can be easly transalted if need be. ‘modulename’ and ‘[yourplugin]:view’ and used threw out Moodle and should be set as a minimum.

/grade/report/[yourplugin]/version.php
<?php
$plugin->version = 2008060500;
$plugin->requires = 2008060500;
?>

This is the version file for the plug-in and should use the current date.

/grade/report/[yourplugin]/index.php
This is the file that will be ran/viewed when the user views the report. Links to it will be automatically generated if you set everything up correctly.

/grade/report/[yourplugin]/lib.php
It is recommend that you use this file to make a class witch extends the grade_report class to get access to use full methods and variables to make your report plug-in however it is not necessary to do so and a plug-in could be developed with out this file.

For my text based statistics plug-in i have made an harvest, report and adapter methods in side a class witch extends grade_report. Then to keep with the modular design, i have made an abstract class called stats witch can be extended to add in new statistics with out modifying other parts of the plug-ins code. Currently i have highest, lowest, median, mode, mean and standard deviation sub classes but a new statistics could be added by simply making a new class that extends stats and has a report method to calculate it (more about the design in my next blog post).

For more information about grade book plugi-in’s in Moodle see the tutorial here.

Debugging Moodle

May 30th, 2008

bug1.jpgOne of the first things i noticed when i started playing around with Moodle’s code was that PHP errors would not show up when you made a mistake in your code and you would be greeted with a blank white page or just part of the page missing when you try to load a page with an error on it. This is due to error catching that Moodle is doing witch is a good thing when you have production level code and users using your site but for development it makes debugging code a pain.

To see PHP errors and warnings simple go to Server -> Debugging in the administration options and you can select the level of PHP error reporting from only fatal errors, warnings and notices, all PHP debugging messages and a developer level that will give you even more then PHP error reporting and add additional Moodle related debugging messages. On this page you can also set if you want errors to go to a log file, witch is use full if you still have normal users on your site and do not want to break the layout or cover the page in debugging messages, or to put the errors in the html. There is also a nice option built in to send errors to an e-mail address when they happen so during production you will be notified of new possible bugs and errors live (i had to manually add this kind of feature to compsci.ca and dwite.org software, so it is nice to see it built in to Moodle). Lastly there is an option to add performance related debugging information to the footer, witch is good for testing if your effected the performance of the software.

You can further tweak the performance debugging information by editing the config-dist.php file:

From the config-dist.php comments

// Performance profiling
//
// If you set Debug to "Yes" in the Configuration->Variables page some
// performance profiling data will show up on your footer (in default theme).
// With these settings you get more granular control over the capture
// and printout of the data
//
// Capture performance profiling data
// define('MDL_PERF' , true);
//
// Capture additional data from DB
// define('MDL_PERFDB' , true);
//
// Print to log (for passive profiling of production servers)
// define('MDL_PERFTOLOG' , true);
//
// Print to footer (works with the default theme)
// define('MDL_PERFTOFOOT', true);

If for some reason you can not get to Server -> Debugging you can still get debugging information by either editing the database or adding a few lines to config.php.

In config.php add:

$CFG->debug=2047;
$CFG->debugdisplay=1;

or in the database:

UPDATE `mdl_config` SET `value` = '2047' WHERE `name` ='debug';

This post is based on information i found in the Moodle documentation and wiki witch can be found here.