More Visualizations and a Widget
I have finished two more visualizations based on the grade distribution. They are:
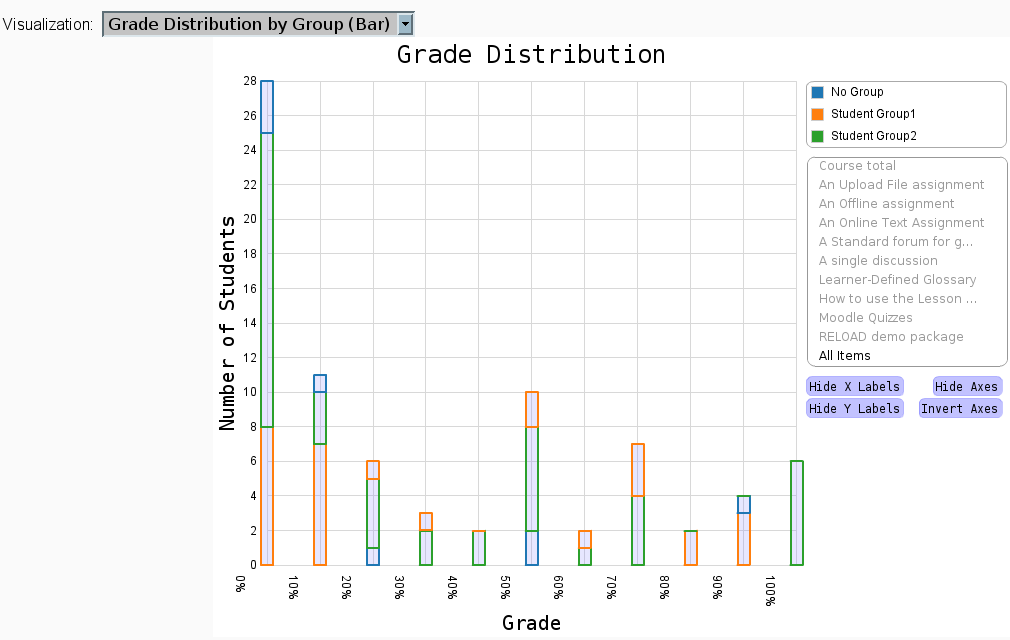
Grade Distribution by Group in a bar graph:
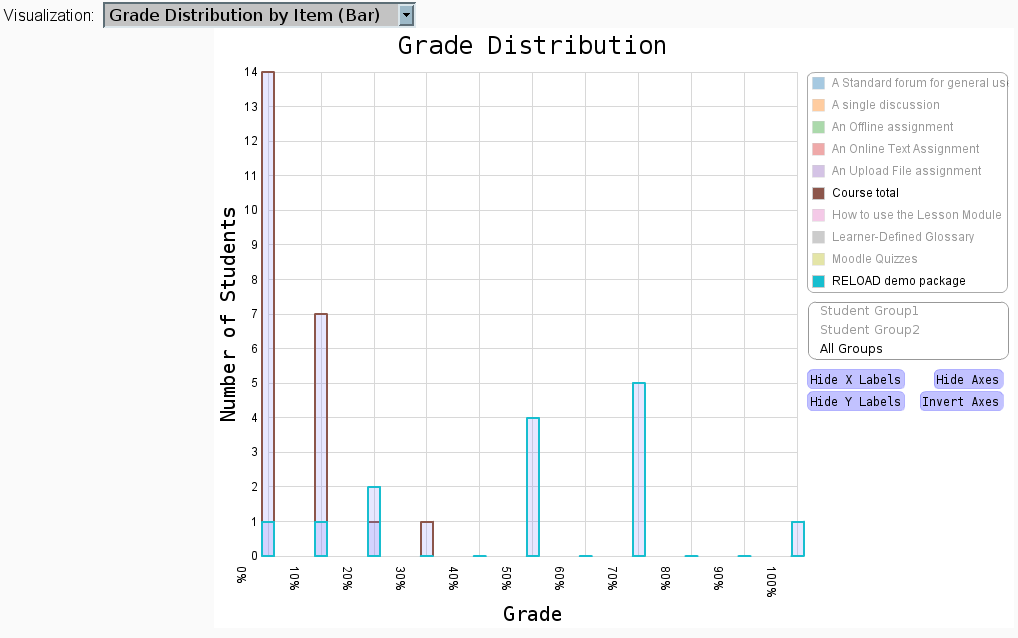
Grade Distribution by Item in a bar graph:
I have also added a new user interface widget witch i call a selector that looks like a legend however only one item on it can be shown at once. When a new item is selected a request is sent to the Moodle back end to get new data based on the value of the selectors item. This allows for selectors to have many diffrent functionality that a developer can program in from the visualization class on the Moodle side of things with out having to change any action script or plug-in code.
I have also change how nodes and edges are hidden when you click on a legend item. Be for the visualization would just set the visible property of the nodes and edges to false but now it will remove the nodes and edges from the data list (tree) and put them back once requested. This allows for live scaling and resizing of the axes and layout, witch makes the char much easier to read and looks much cooler when animated.
There has also been a lot of refactoring and bug fixes to the flex/action script code i made for the front end including fixing a memory leak so things should run smoother.
I should have the new code up on the test site tonight and plan on making a commit with the new code to the CVN once i do a bit more testing on it.