Archive for July, 2008

More Visualizations and a Widget

Thursday, July 31st, 2008

I have finished two more visualizations based on the grade distribution. They are:

Grade Distribution by Group in a bar graph:

gadedistgroupbar.png

Grade Distribution by Item in a bar graph:

gadedistitembar.png

I have also added a new user interface widget witch i call a selector that looks like a legend however only one item on it can be shown at once. When a new item is selected a request is sent to the Moodle back end to get new data based on the value of the selectors item. This allows for selectors to have many diffrent functionality that a developer can program in from the visualization class on the Moodle side of things with out having to change any action script or plug-in code.

I have also change how nodes and edges are hidden when you click on a legend item. Be for the visualization would just set the visible property of the nodes and edges to false but now it will remove the nodes and edges from the data list (tree) and put them back once requested. This allows for live scaling and resizing of the axes and layout, witch makes the char much easier to read and looks much cooler when animated.

There has also been a lot of refactoring and bug fixes to the flex/action script code i made for the front end including fixing a memory leak so things should run smoother.

I should have the new code up on the test site tonight and plan on making a commit with the new code to the CVN once i do a bit more testing on it.

Rogers DNS Vulnerability

Monday, July 28th, 2008

This post is a break form development news on the Moodle stats plug-ins to talk about a new DNS vulnerability that could affect all Rogers users in Canada (or at least Ontario).

Update: euphoracle from the #CompSci.ca IRC room called up Rogers tech support and after getting threw the first few “tiers” of teach support asking him to run virus scans got to a Rogers tech that knew about the issue and claimed that they are working on the problem but there is currently no ETA. So it seems Rogers knows about the issue but has yet to fix it.

Earlier this month news of a new DNS attack was leaked to the public with details a method to poison the cache of a DNS server and allow an attacker to redirect any domain to there own ip/site.

The implications of this are massive but i will not go in to the details as that has been talked about already on many more popular blogs and in some media sources. What i do want to talk about is Rogers (one of the largest Canadian cable ISPs).

All DNS providers (including ISPs) have had since July 8th to patch and/or fix this vulnerability but from some simple testing the #compsci.ca IRC room and my self have conducted it seems that Rogers has failed to put any kind of protection in place to stop this attack (witch is ironic as they just started hijacking there own DNS server to place ads on 404 pages).

If you are a rogers user you should immediately change your DNS settings to use a secure server such as the bell ones ( 207.164.234.193 and 207.164.234.129) or use OpenDNS (witch has some ads on 404 pages). I would also recommend that all Rogers customers tell Rogers to patch there system ASAP.

If you want to see if your DNS server is secure check out http://www.doxpara.com/?p=1176 (thanks to Dan Kaminsky) and click on “Check my DNS” on the right hand side. This is what we used to test Rogers and other CompSci.ca users ISPs.

CVS: CONTRIB-497 + CONTRIB-496 24/July/08

Thursday, July 24th, 2008

I have updated the test site with the new visualization!

CONTRIB-497
*Added new visualization, Grade Distribution
*Fixed some minor bugs
*Made abstract visualization class for creating visualizations by making classes witch extend it.
*Made visual_settings.php witch takes a visualization class and truns it in to XML witch flex can read in.
*Made flex visualization application read in XML formated settings as well as tab formated data from moodle and combind them to make a custom visualization.
*Made flex visualization application read and use langue strings from moodle.
*Added printer firendly tabTODO:
*Add more visualizations
*Refactor some of the flex/actionscript code
*More douctenation
*More UI functions for the flex application

MODIFY plugins/grade/report/visual/lib.php   Rev. 1.3   (+186 -59 lines)
MODIFY plugins/grade/report/visual/flare_visualization/flare_visualization.as   Rev. 1.3   (+383 -111 lines)
ADD plugins/grade/report/visual/visualizations/visualization.php   Rev. 1.1   (+0 -0 lines)
MODIFY plugins/grade/report/visual/flare_visualization.swf   Rev. 1.3   (+0 -0 lines)
MODIFY plugins/grade/report/visual/lang/en_utf8/gradereport_visual.php   Rev. 1.2   (+27 -0 lines)
MODIFY plugins/grade/report/visual/data.php   Rev. 1.2   (+5 -4 lines)
MODIFY plugins/grade/report/visual/index.php   Rev. 1.3   (+12 -3 lines)
MODIFY plugins/grade/report/visual/flare_visualization/Button.as   Rev. 1.3   (+33 -8 lines)
ADD plugins/grade/report/visual/visualizations/visual_grade_distribution.php   Rev. 1.1   (+0 -0 lines)
MODIFY plugins/grade/report/visual/flex.php   Rev. 1.3   (+23 -57 lines)
ADD plugins/grade/report/visual/visualizations/visual_grades_vs_students.php   Rev. 1.1   (+0 -0 lines)
ADD plugins/grade/report/visual/visual_settings.php   Rev. 1.1   (+0 -0 lines)
MODIFY plugins/grade/report/visual/tabs.php   Rev. 1.3   (+5 -0 lines)
DEL plugins/grade/report/visual/flare_visualization/.settings/Attic/org.eclipse.core.resources.prefs   Rev. 1.2   (+0 -0 lines)
MODIFY plugins/grade/report/visual/flare_visualization/bin-debug/flare_visualization.swf   Rev. 1.3   (+0 -0 lines)

CONTRIB-496
*Fixed a minor bug in lib.php witch caused some problems geting a list of statistics used in the plug-in.

MODIFY plugins/grade/report/stats/lib.php   Rev. 1.5   (+13 -13 lines)

Grade Distribution

Thursday, July 24th, 2008

I have finally been able to get another visualization working for the report/visual plug-in. This one is a Grade Distribution line graph that can show the distribution of grades for any group or item in a course including aggregated items like course total (a students overall mark in a course). Some screen shots of the new visualization can be seen below:

gadedist.pnggadedist1.pnggadedist2.png

Currently the grades are being place in groups of 10% (0% - 9.99..%, 10% - 19.99…, and so on) witch is used as the x axis and the number of students is used as the y axis. As with the other visualization, the axis are invertible and the same UI and features are used.

Unfortunately the changes to the back and front ends of the plug-in to make them dynamic as possible and to allow creation of new visualizations simply by making a PHP class in Moodle was more complicated then anticipated and has set me some what behind my original schedule for the project. Hopefully i will be able to make up for some of the lost time and still be able to get in all the features i wanted.

Moodle Easter Egg?

Monday, July 21st, 2008

moodle-egg.jpgWell looking for the Moodle library file, “weblib.php”, i came across an oddly named file calledwomenslib.php. After wondering what kind of library could possible be called that and what could it do for a few seconds i opened it up and found the fallowing code:

<?php
include(’../config.php’);
redirect(’http://en.wikipedia.org/wiki/Women%27s_liberation’);
?>

This file also seems to be on the main moodle.org site: http://moodle.org/lib/womenslib.php

It would seem that the Moodle core developers have a senses of humor.

Bugs, Patches and Open Source

Saturday, July 19th, 2008

moodlepatch.jpgOne of the requirements of my project is to develop the stats and visual plug-in for Moodle 2.0, a version of Moodle witch is still under development. This means that if done right my plug-in will be compatible with the new release of Moodle once it comes out as well as take advantages of the new functions and frame works that are being added and are introduced in PHP5 (Moodle 2.x is moving from PHP4 to PHP5). However it also means that some of the functions i am using from the Moodle frame work are still buggy and at rare times new bugs are introduced to the development branch as the core developers work towards the new release.

Such seems to be the case tonight where a new bug showed up once i updated from development branch and all of a sudden the group (class/course sections) functions started messing up in my plug-in. After searching my own code for some time, thinking it was something i changed, i traced the bug back in to the Moodle core functions where there was a check that was failing as a side effect of a change to a seemingly unrelated piece of code.

So i whipped up a bug report and a patch to fix the bug and summited it to the Moodle tracker in the hopes that some one would look over my report in a day or two and look in to it. After all i was posting it at 3:37 AM on the week end, however to my amazement 30 minutes latter my report had been looked in to, commented on, a patch (based on mine but better) was committed to the development branch and the tracker issue was closed.

This is one of the reasons why i love the Open Source Ideology so much. In a closed source corporate environment a bug like this could take days to get from begin reported, to being looked in to, to being fixed (especially since it was reported early in the morning on Saturday) causing untold amount of frustration to the users and delays to developers working on the code effected by the bug. If Moodle was closed source software for witch i was creating the same plug-in from a limited plug-in API available to the public my bug report would have not be any where as nearly detailed in to the cause of and how to fix the bug and would be limited to simply saying “hey X is not working for some reason” and i deftly would not haven been able to give a patch that the core developers could base a fix on, causing lost man hours for the payed developers looking in to and tracking down a bug in a vague report that could be better spent.

There is also a great feeling knowing that you where able to help out an Open Source project and that your patch (as simple as it may be in this case) got in to the code base and will help others. It is also great thing to be able to fix the bugs you come across in software, change it in any way you may feel like or just see how things work under the hood.

Now if i could only get the bugs in windows mobile on my phone fixed….

Playing with XML

Wednesday, July 16th, 2008

In addition to the printer issue i am also working on making the flex with flare interface more dynamic in that it can be heavily changed from the Moodle back end with out the need for touching the actionscript code.

As Moodle is a PHP project there may be few developers willing to update the flex side of the application i am making, so in an effort to making the project maintainable in the future i am try to keep as many settings in the Moodle side as possible. The way i am accomplishing this in an elegent manner is to have a dynamically generated XML file with each setting for the current visualizations being displayed to the user, witch will be read in by the flex application and determine how and what visualization is being displayed.

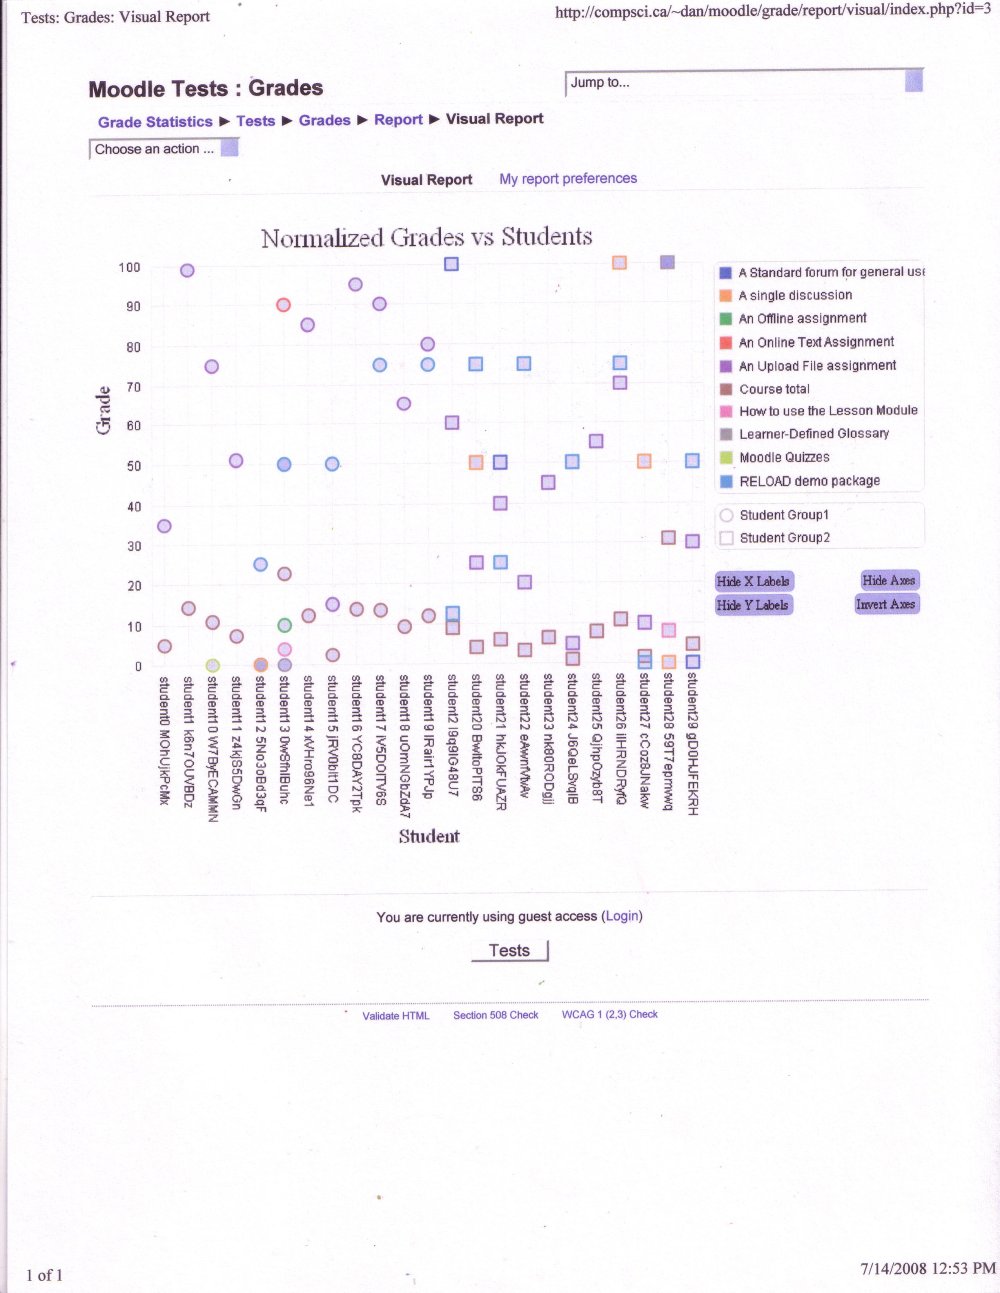
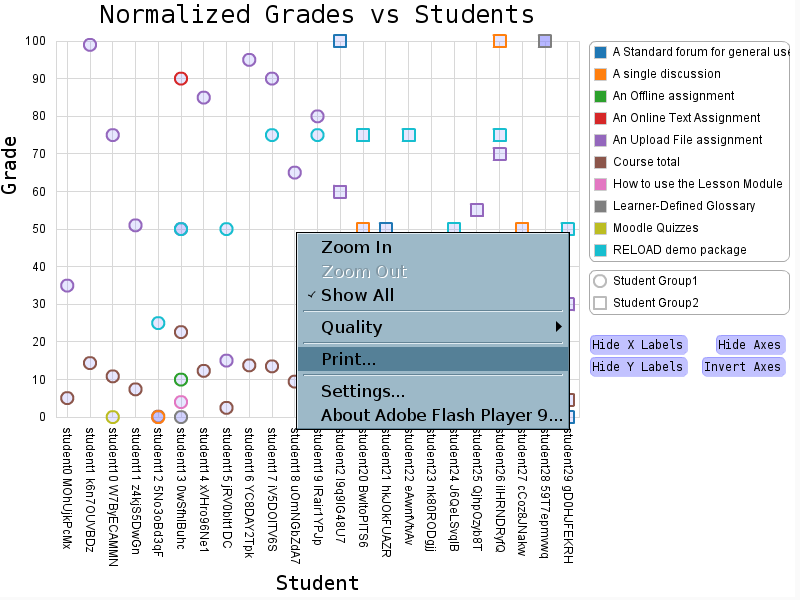
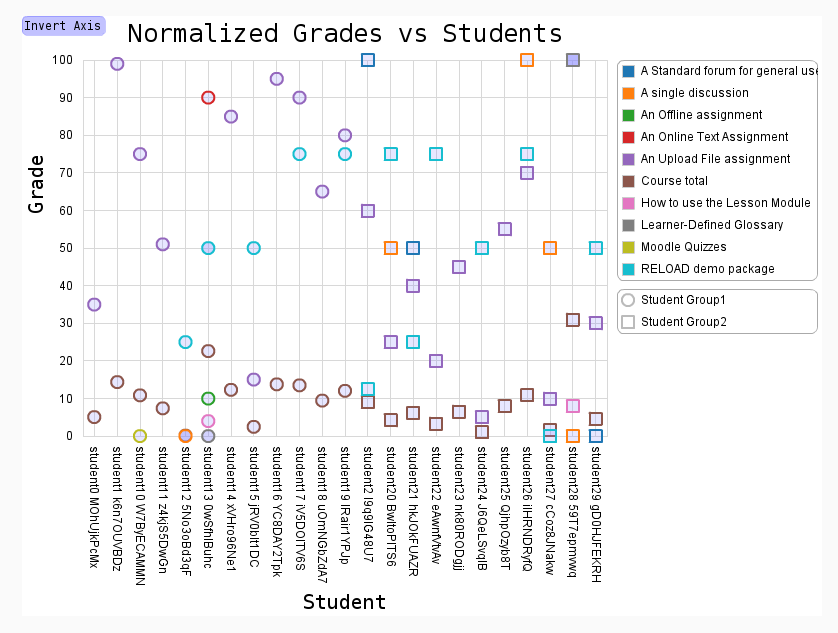
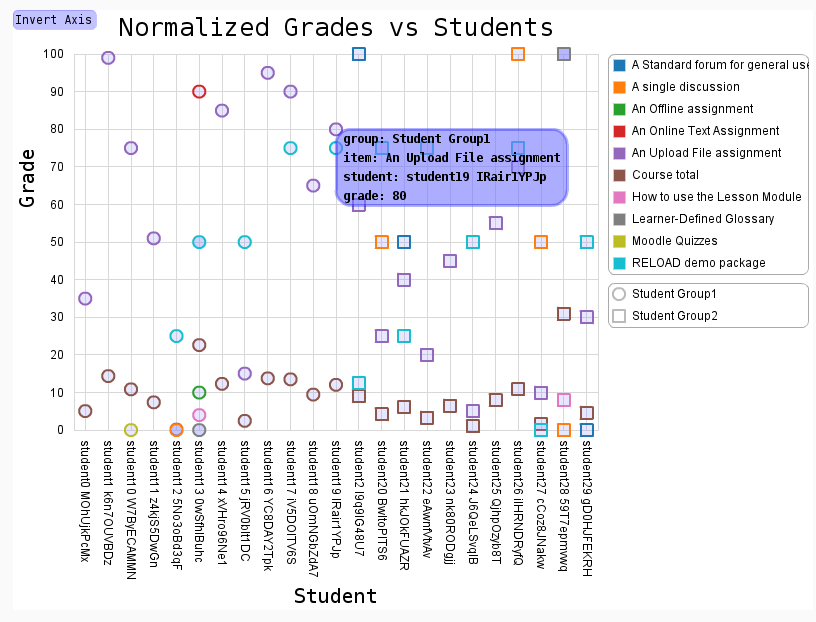
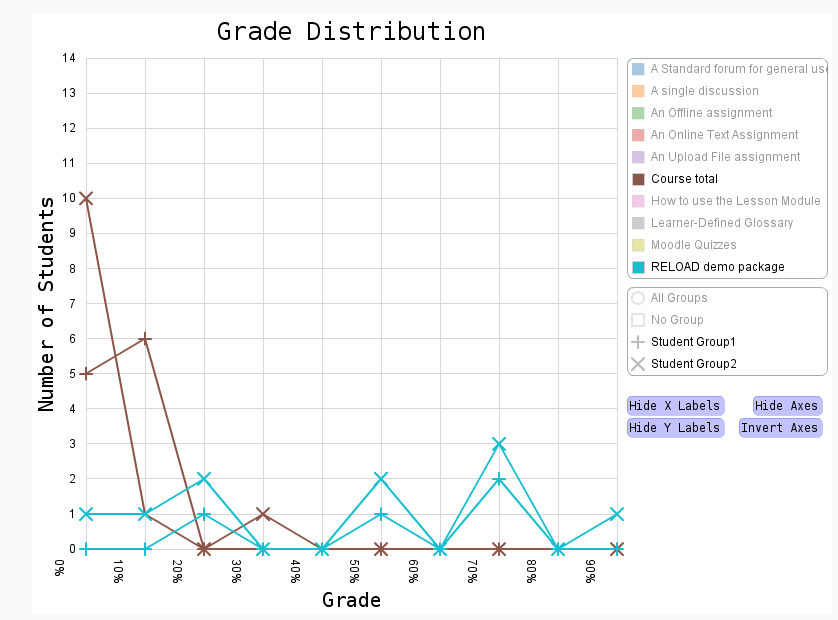
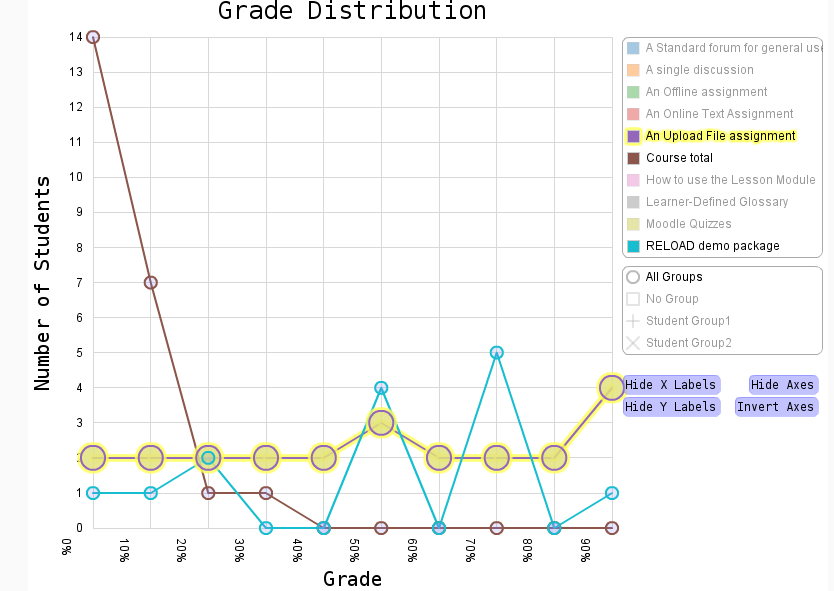
This XML settings file will have everything needed to define a
visualization (except the raw data) including the language strings, the flare layout type to use, what encoders to use, the legends to be displayed, what data is on the axes, and even the fonts and colors to be used. This XML file will be generated based on a visualization class for each visualization witch will be dynamically loaded in. In theory this should allow for new visualizations to be added in with no need to change the actionscript code that makes up the flex application or to change any code in the plug-in (just drop the new class in the visualization dir).

The parsing of the XML in to the flex application is made impressively easy in Flex 3 with the XML class. As can be seen from this relay cool example provided by adobe, XML code can be read in (in this example hard coded) in about one line and then be tread like a class but with some additional tricks and abilities to share. To make things even easier this XML functionality can be used with the URLLoader and URLRequest classes witch my application already uses to load tab formated data for flare such as in this example (also from adobe).

On the Moodle side of things there is also some functions for dealing with XML however they are apparently a bit out of date. Moodle includes an XML library in it’s framework (/lib/phpxml/xml.php) witch has a function for converting a PHP array into an XML string. Unfortunately this library seems to have been made for an older version of PHP and now spits out:

Notice: Only variable references should be returned by reference in /var/www/localhost/htdocs/moodle/lib/phpxml/xml.php on line 50

when used due to it returning a reference to a string rather then the value of it when debugging is on. This normally would not be a big problem but it breaks the XML format and makes the loading of the settings from the flex application fail. As a temporary fix i have added the fallowing to turn off the reporting of any error messages in the generated XML file as no human would be reading it:

error_reporting(0);

It’s nice when there are APIs and library’s so you can constraint on the problem and making the solution and not messing around formating XML ;)

CVS: CONTRIB-497 - 15/July/08

Tuesday, July 15th, 2008

CONTRIB-497
Cleaned up some of the code for report/visual and the flex based application for viewing the visualizations.Improved the UI of the visualization.Added documentation to both the php and actionscript 3 (flex) code.Removed some unneeded files.TODO:
*Add more visualizations.
*Add printer firendly version.
*Make flex appplications settings less hardcoded and loaded from moodle.
*Load lang files from moodle to flex for full language support.
*Add a settings page for the report.

MODIFY plugins/grade/report/visual/flare_visualization/ bin-debug/flare_visualization.swf   Rev. 1.2   (+0 -0 lines)
DEL plugins/grade/report/visual/flare_visualization/ bin-debug/history/Attic/history.js   Rev. 1.2   (+0 -0 lines)
MODIFY plugins/grade/report/visual/flex.php   Rev. 1.2   (+28 -0 lines)
DEL plugins/grade/report/visual/flare_visualization/ html-template/history/Attic/history.js   Rev. 1.2   (+0 -0 lines)
MODIFY plugins/grade/report/visual/index.php   Rev. 1.2   (+30 -1 lines)
MODIFY plugins/grade/report/visual/flare_visualization/ Button.as   Rev. 1.2   (+48 -2 lines)
MODIFY plugins/grade/report/visual/flare_visualization/ flare_visualization.as   Rev. 1.2   (+539 -59 lines)
DEL plugins/grade/report/visual/flare_visualization/ html-template/Attic/index.template.html   Rev. 1.2   (+0 -0 lines)
DEL plugins/grade/report/visual/flare_visualization/ html-template/history/Attic/history.css   Rev. 1.2   (+0 -0 lines)
MODIFY plugins/grade/report/visual/tabs.php   Rev. 1.2   (+23 -0 lines)
MODIFY plugins/grade/report/visual/flare_visualization.swf   Rev. 1.2   (+0 -0 lines)
ADD plugins/grade/report/visual/data.php   Rev. 1.1   (+0 -0 lines)
DEL plugins/grade/report/visual/flare_visualization/ html-template/history/Attic/historyFrame.html   Rev. 1.2   (+0 -0 lines)
DEL plugins/grade/report/visual/flare_visualization/ html-template/Attic/playerProductInstall.swf   Rev. 1.2   (+0 -0 lines)
DEL plugins/grade/report/visual/flare_visualization/ html-template/Attic/AC_OETags.js   Rev. 1.2   (+0 -0 lines)
DEL plugins/grade/report/visual/Attic/json_data.php   Rev. 1.2   (+0 -0 lines)
DEL plugins/grade/report/visual/flare_visualization/ bin-debug/history/Attic/history.css   Rev. 1.2   (+0 -0 lines)
MODIFY plugins/grade/report/visual/lib.php   Rev. 1.2   (+25 -0 lines)
DEL plugins/grade/report/visual/flare_visualization/ bin-debug/history/Attic/historyFrame.html   Rev. 1.2   (+0 -0 lines

Printer Friendly

Monday, July 14th, 2008

One of the popular requests relating to the grade statics project from the Moodle community was a printer versions of the statics and visualizations. This is rather trivial to do for the report/stats plug-in as all the content is text based however it becomes some what more complicated for report/visual as the content is flash based and more dynamic.

Some browsers play nice when printing a page with flash content on it and will treat it like an image (as shown in scan below of a print out of the demo site in fire fox).

firefox_printing_flash.jpg

This would allow for a printer friendly page to be made that would work with browsers that print flash content by creating a page with just the visualizations on it and a slightly modified interface. However there is another method that i have started looking in to that might give even better results.

Flash it’s self has support for printing witch can be some what controlled from the flash (or flex in this case) application running in the browser, allowing for better resolution prints (as flash graphics are vector based) and allows for printing with in the application rather then having to load a new page.

A simple example of this can be seen in the right click menu over a flash application witch gives a print option.

flash_printing.png

Unfortunately, currently my application dose not quite print an accurate representation of the visualization using this method as can be seen below in a scan of the printed page.

flash_printing_flash.jpg

So the next step in the goal for a printer friendly flash/flex application is research the printing functions and abilities of action script and flex and then to try implementing a solution witch will ideally hide the visualization’s controls (buttons) and then print the visualization at the correct size to match that of the paper it is being printed on.

Start of a UI

Wednesday, July 2nd, 2008

This week i have been working on the user interface (UI) for the Flare based visualizations that will be shown in the report/visual plug-in.

So far i have the ability to invert the axis (with a cool animation), show and hide any item in the legends, click on a data point to show the information related to it and highlight all the data points related to a legend item.

A demo of one visualization with this UI can be found on the test site at http://compsci.ca/~dan/moodle where you can select “Moodle Tests“, login in as guest, select “Grades” in the lower left and then pick “Visual Report” from the drop down menu. You will have to have flash 9 installed (if you don’t it should try to install if for you).

Here are some screen shots of the visual report so far:

visual_ui1.pngvisual_ui2.pngvisual_ui4.pngvisual_ui5.pngvisual_ui6.pngvisual_ui7.pngvisual_ui8.png