grade/report/stats
The first of two plug-ins i am making for the Animated Grade Statistics Report project is at a point where i think i can start showing it to the community and get more feed back. I am talking with Anthony Borrow about getting a tracker issue set up on the Moodle Tracker and get CVS access so i can work in/with the repo.
In till then, i have some screen shots of what the the text based plug-in for stats currently looks like:

grade/report/stats is some what based on grade/report/grader (an existing standard plug-in) in terms of layout and how the data is presented but rather then students grades for each item it displays statistics for both items and aggregations (such as Course total). Each statistics, such as Highest, Lowest, etc, is a class that extends an abstract class called stats. Theses classes are then automatically loaded in and the grades witch are harvested from the database and filtered are passed to a report method in each class witch returns the result of the statistics calculations and passed along to an adapter method witch changes it all in to a nice HTML based table (using flexible_table class).
Using this method it means that a new statistic could be added to the table simply by making a new class for it with the code to process the grades and adding some language strings. So no code in the plug-in it’s self will need to be changed.
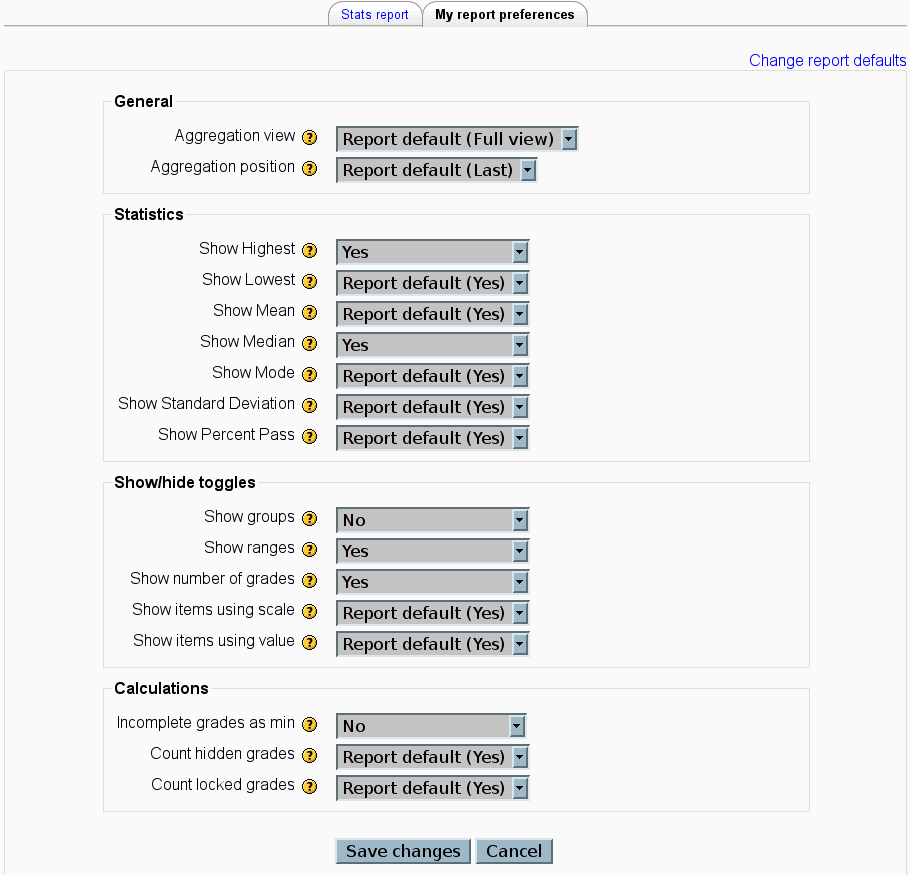
There are also user options available in this plug-in witch allow the user to control what statistics are displayed, how they are calculated, what items are displayed and the format the stats are displayed in. The settings for what stats are to be displayed are automatically generated based on what stats classes are found, so a person adding a new statistic to the plug-in will not have to worry about the settings page.

Like the grader report there are also toggles on the top of the report witch can be used to display less or more information and there is the functionality to filter the statistics by group. So if wanted only the statistics for one section of a course or one particular group can be displayed. You can also see in the last screen shot the issue mentioned in my last blog post here, about scales returning some interesting results for some statistics, tho if desired all scale based items can be hidden in the plug-ins options.
There are still a few things left to do for the text based report:
- Add outcomes
- Improve the look and readability
- Add admin/teacher settings to override if a student can see a given statistic.
- Add help text for the settings page
- More settings
- Let stats classes have the ability to set the format of the statistics they output (value, scale, letter, percent).
- Printable version.
As some of theses are less critical i will probably start working on the visual plug-in as it is more important well getting feed back and the tracker/cvs access set up and come back to it latter on in the project.
Onward to flare!
June 11th, 2008 at 7:54 am
[…] just about ready to put a text-based version of his Moodle stats plugin up for public comment—screenshots are already available. Your feedback would be greatly appreciated. I’ll be begging for feedback on other […]