Grade Distribution
I have finally been able to get another visualization working for the report/visual plug-in. This one is a Grade Distribution line graph that can show the distribution of grades for any group or item in a course including aggregated items like course total (a students overall mark in a course). Some screen shots of the new visualization can be seen below:
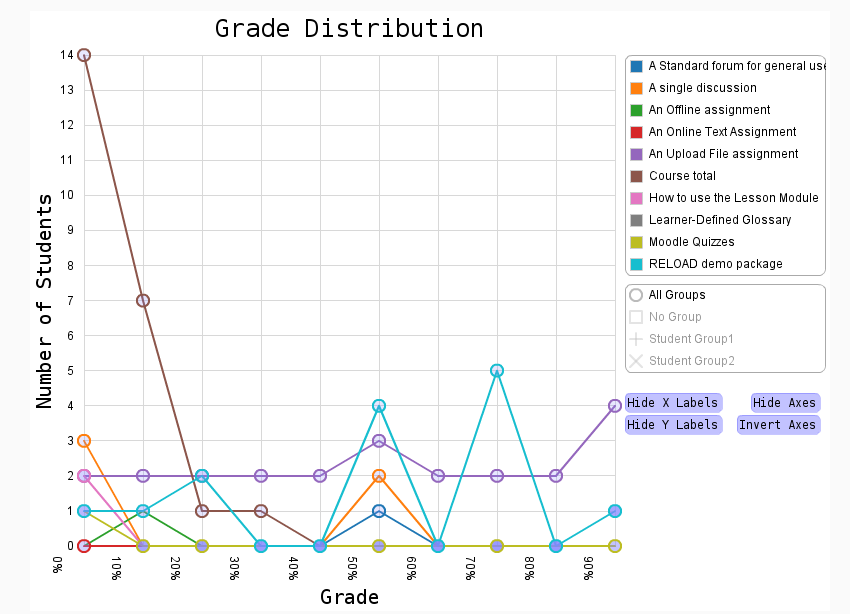
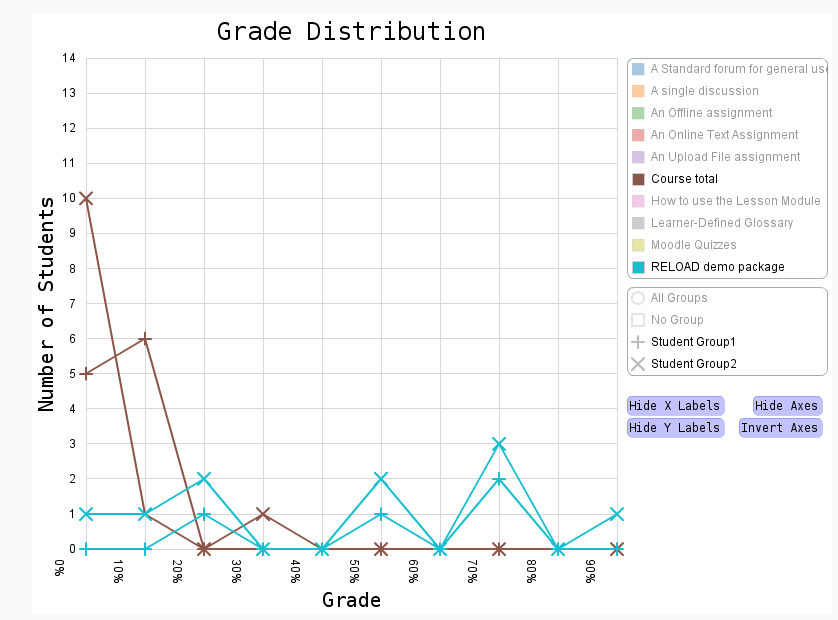
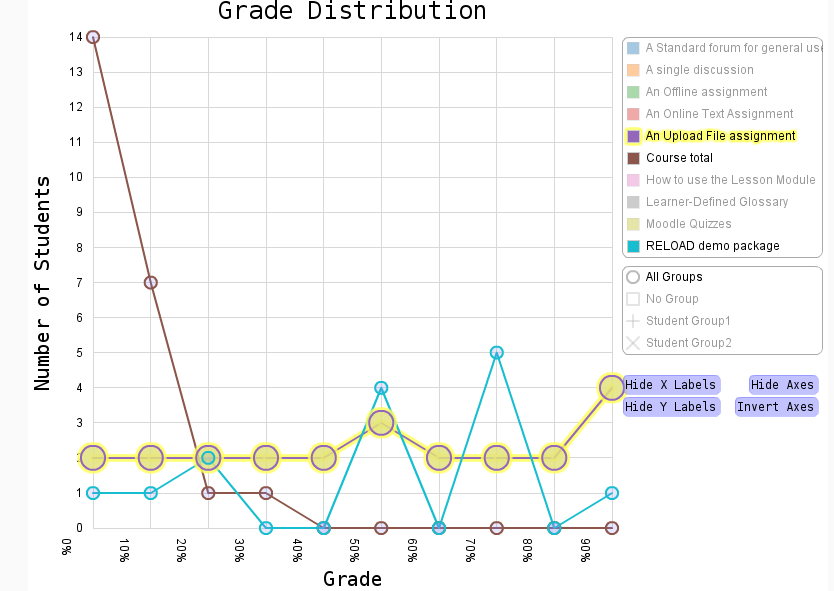
Currently the grades are being place in groups of 10% (0% - 9.99..%, 10% - 19.99…, and so on) witch is used as the x axis and the number of students is used as the y axis. As with the other visualization, the axis are invertible and the same UI and features are used.
Unfortunately the changes to the back and front ends of the plug-in to make them dynamic as possible and to allow creation of new visualizations simply by making a PHP class in Moodle was more complicated then anticipated and has set me some what behind my original schedule for the project. Hopefully i will be able to make up for some of the lost time and still be able to get in all the features i wanted.
July 24th, 2008 at 4:24 am
[…] I have updated the test site with the new visualization! […]
July 28th, 2008 at 8:21 am
[…] Servos has another Moodle visualization working. Anyone want to give me some money so I can hire this […]