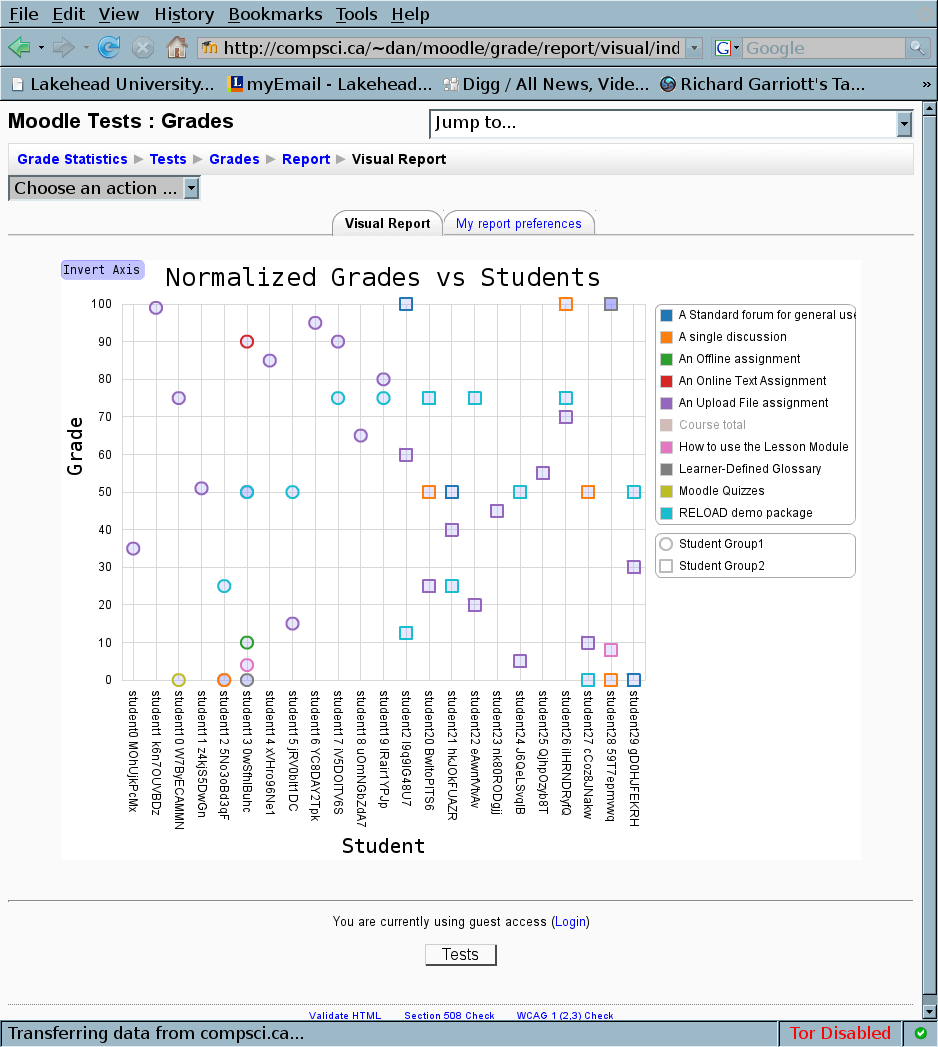
Start of a UI
This week i have been working on the user interface (UI) for the Flare based visualizations that will be shown in the report/visual plug-in.
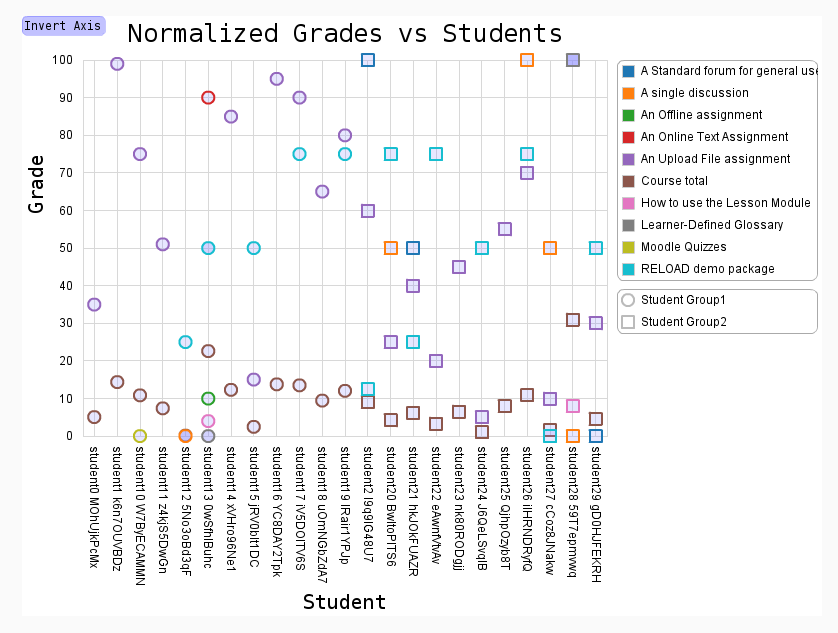
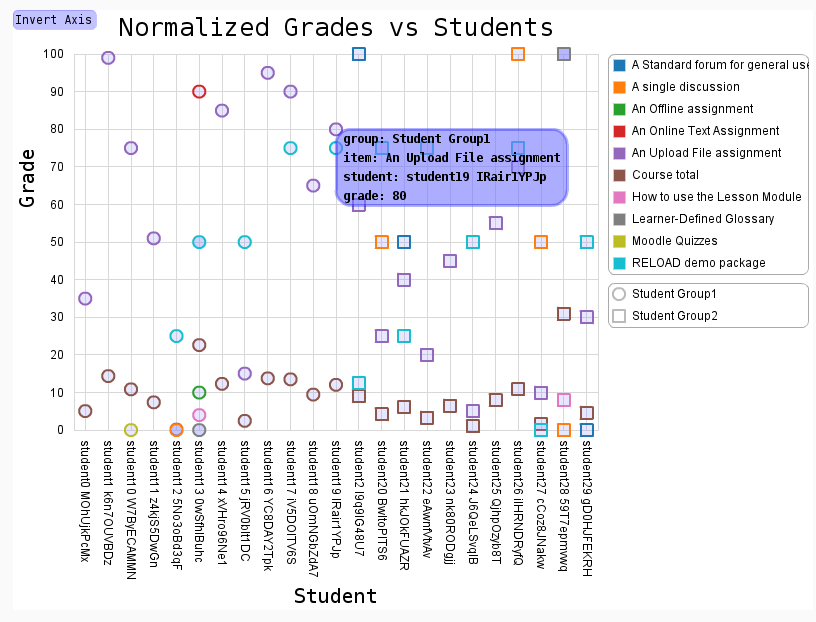
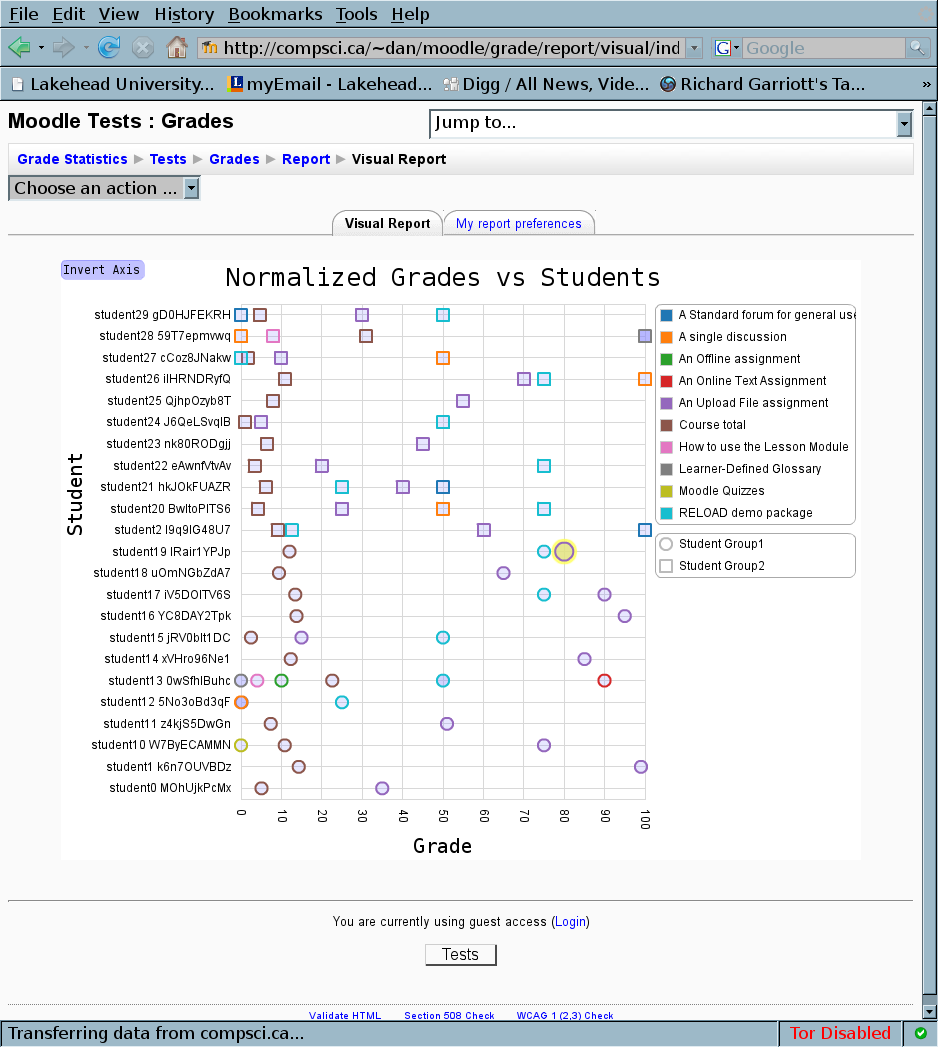
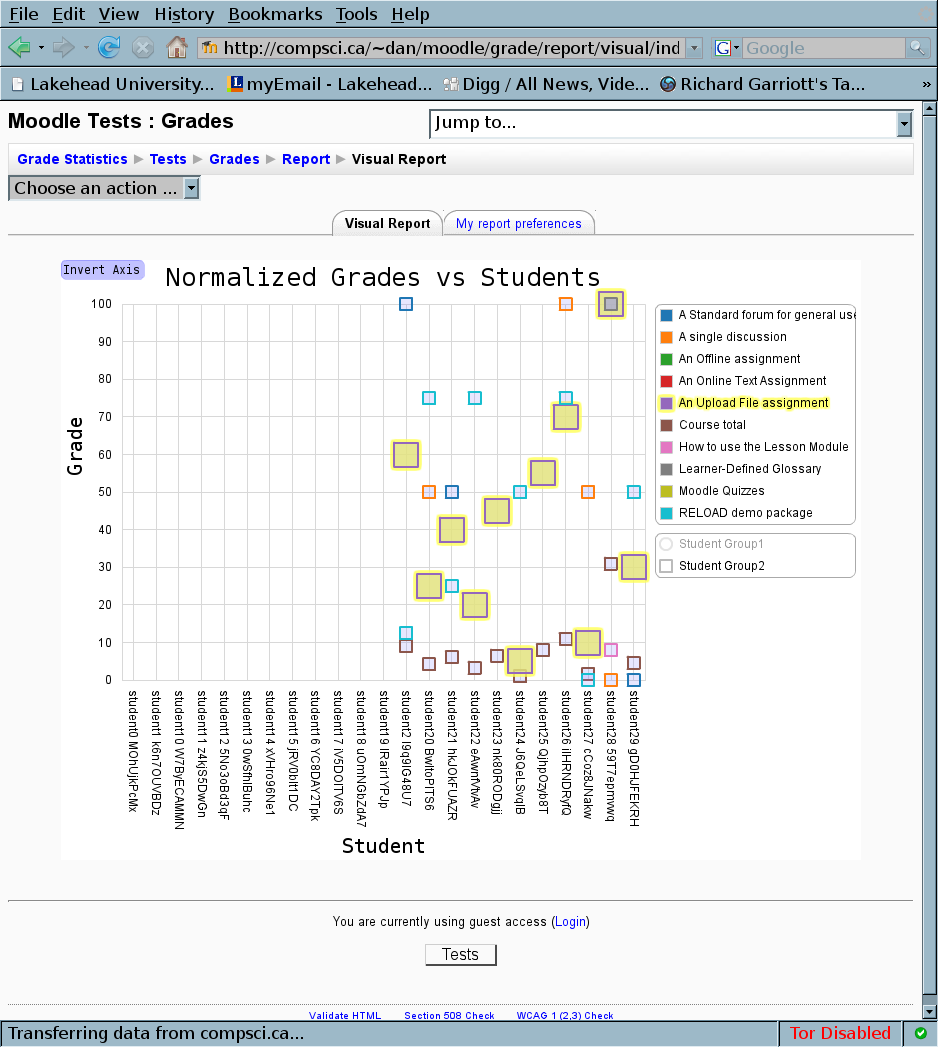
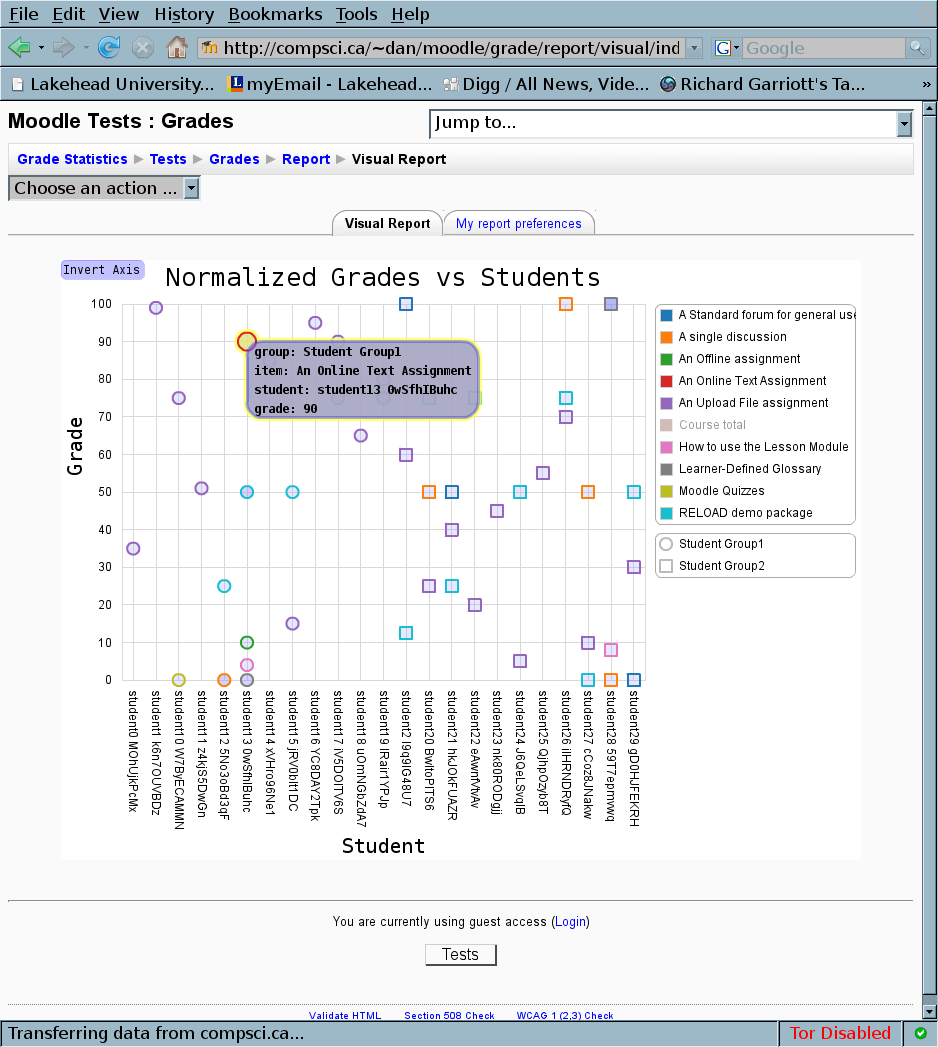
So far i have the ability to invert the axis (with a cool animation), show and hide any item in the legends, click on a data point to show the information related to it and highlight all the data points related to a legend item.
A demo of one visualization with this UI can be found on the test site at http://compsci.ca/~dan/moodle where you can select “Moodle Tests“, login in as guest, select “Grades” in the lower left and then pick “Visual Report” from the drop down menu. You will have to have flash 9 installed (if you don’t it should try to install if for you).
Here are some screen shots of the visual report so far:

July 2nd, 2008 at 5:50 pm
Looking good Dan!
Though the navigation to the UI page is crap. I got lost… twice… and I had instructions available from this page. I blame the “please choose an action” drop-down element.
July 2nd, 2008 at 10:28 pm
I am glad you like what i made, unfrontly i do not have much control of the UI in the rest of Moodle. I also find there use of drop down elements a bit odd but the version i am running as the test site is a development version of the yet to be officially released Moodle 2.0 so there might be improvements that have yet to be added.
July 24th, 2008 at 2:10 am
[…] so on) witch is used as the x axis and the number of students is used as the y axis. As with the other visualization, the axis are invertible and the same UI and features are […]